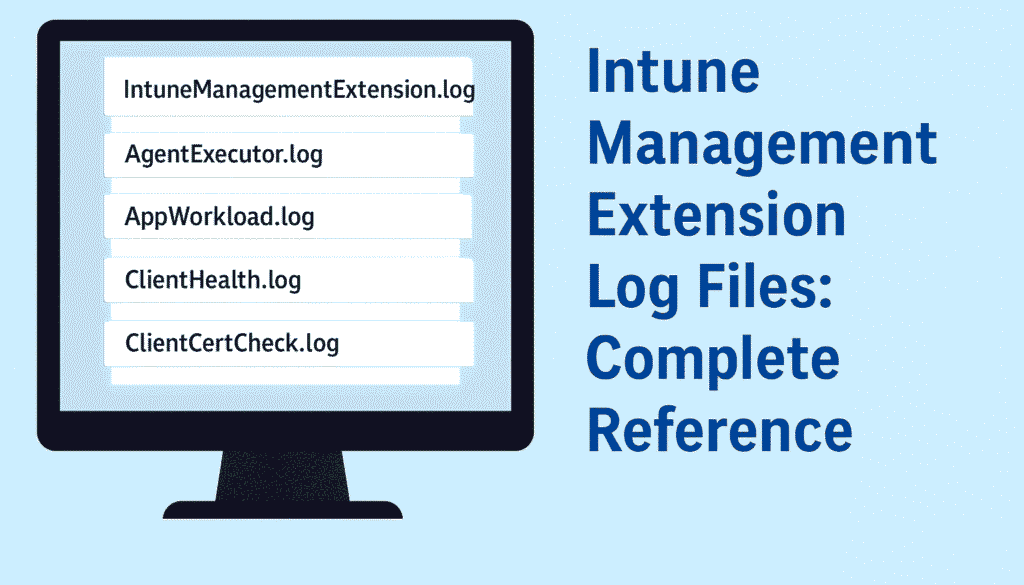
Intune Management Extension Log Files: Complete Reference
Table of content
Introduction
When you manage Windows endpoints with Intune Management Extension, understanding its log files is critical. Whether you are troubleshooting app deployments, script execution or general health issues, IME log files contain the detailed traces you need. In this article we will cover:
-
How to find IME log files
-
The best methods to read them
-
Different access options
-
Maximum size/growth of IME log files
-
Detailed breakdown of each key log file:
-
AgentExecutor.log
-
AppActionProcessor.log
-
AppWorkload.log
-
ClientHealth.log
-
ClientCertCheck.log
-
DeviceHealthMonitoring.log
-
HealthScripts.log
-
IntuneManagementExtension.log
-
Sensor.log
-
Win32AppInventory.log
-
-
A conclusion to summarise and guide your next steps
Let’s dive in.
Finding Intune Management Extension logs
The primary folder where IME writes its logs is:
This folder contains all the major log files used by IME and should be your first stop when investigating issues.
Best Way to Read Intune Management Extension Logs
-
Use a specialized log viewer like CMTrace.exe (from SCCM toolkit) or Notepad++ with monospaced font and timestamp filters — this helps when dealing with large rolling logs.
-
Filter on timestamps to a specific deployment attempt. This means you record the time from the Intune portal when an action was triggered, then open the log and filter by that time.
-
Use search terms like Error, Failed, Download started, Install started, Exit code. These highlight key events quickly.
-
Monitor the rolling nature of logs – older entries may be archived or truncated depending on size and device policy.
-
Having remote access (e.g., via WinRM or PowerShell from Intune) helps when logs are on devices you cannot physically access.
How to access IME Log files
-
Locally on device: navigate to the folder via File Explorer C:\ProgramData\Microsoft\IntuneManagementExtension\Logs.
-
Collect via Intune log collection: you can leverage Intune’s built-in log collection or device diagnostics option to pull these logs remotely from Intune Admin center.
- Go to Intune Admin center and then select Devices > All Devices > select the device for which you need to collect the logs.
- On the top menu bar, click Collect diagnostics.
-
Use Enterprise Log Analytics / Azure Monitor: if you export IME logs to a central workspace, you can query across devices.
Maximum Size of IME Log files
By default, IME log files have a maximum size of 3 MB. Once a log file reaches this limit, a new file is automatically created with the same name, appended by its creation date.
On newly enrolled Intune devices, log files typically start out small (measured in KB). As apps, scripts, and policy assignments are deployed, their size increases accordingly. At present, Microsoft does not support changing the default log file size
Intune Management Extension Log Files – Detailed List
1. AgentExecutor.log
When working with Microsoft Intune, one of the key components behind the scenes is AgentExecutor.exe. This executable resides in C:\Program Files (x86)\Microsoft Intune Management Extension.
Whenever you create Intune remediation tasks or target a PowerShell script to a device, AgentExecutor.exe is invoked to handle the execution. Its activities are carefully tracked in the AgentExecutor.log file, making it an essential resource for troubleshooting.
Intune remediation scripts are cached locally on the device in: C:\WINDOWS\IMECache\HealthScripts\
2. AppActionProcessor.log
Tracks high-level app install/uninstall actions processed by IME. This log shows when IME initiates an install/uninstall for a Win32 application, its status, and transitions.
Useful for seeing the workflow before the actual installer runs. This also checks the application Detection and App applicability check for all applications.
3. AppWorkload.log
Focuses on the “workload” phase for Win32 apps, content download, staging, execution and clean-up. If content fails to download or fails in staging, this log reveals it.
Look here for BITS/Delivery Optimization and download-related errors.
4. ClientHealth.log
Monitors the health of the IME agent itself. Contains entries about agent start-up, failures, service restarts, connectivity to Intune, mis-configuration, and certificate issues.
If IME never runs tasks, check this log first.
5. ClientCertCheck.log
Logs certificate validation and checking for the agent and MDM/IME components. Issues with enrollment, certificate renewal or connectivity may show up here.
If you suspect certificate or compliance problems, inspect this file. ClientCertCheck.exe is used to verify and validate the certificate.
6. DeviceHealthMonitoring.log
In Windows 10 and 11, telemetry automatically gathers and transmits system usage data to Microsoft. The DeviceHealthMonitoring.log file captures events tied to this process, leveraging the 1DS SDK which is Microsoft’s open-source logging library built for handling text-based events and securely sending them to public endpoints.
This log records telemetry and device-health monitoring information collected by the IME agent, including device resource status, service health, and periodic checks. Its primary purpose is proactive monitoring of system health, rather than serving as a direct diagnostic tool for application failures.
7. HealthScripts.log
The HealthScripts component of the Intune Management Extension (IME) is responsible for checking any assigned Intune detection and remediation scripts on a device and executing them according to their schedule. All activity is logged in the HealthScripts.log file, which records script execution details, output, errors, and exit codes.
This log provides visibility into the run history of health check and remediation scripts delivered via IME, making it the place to track their behavior and results. It also clearly separates script-based health logic from app installation logic, ensuring that monitoring and troubleshooting remain distinct.
8. IntuneManagementExtension.log
A “bootstrap” log that captures when the IME service installs, initial start, upgrade events, and version checks. Less about individual tasks and more about the IME lifecycle.
Check this when IME itself fails to run or install.
The IME Agent log captures all core activities of the Intune Management Extension, including agent check-ins, policy requests, package management, policy processing, and reporting.
This log serves as a comprehensive record of communication and task execution between the agent and Intune, making it the primary source for tracking how policies and packages are delivered and processed on a device.
9. Sensor.log
The Sensor.log file in the Intune Management Extension (IME) records information generated by the SensorFramework component. It captures a wide range of device event details, including boot performance, CPU summary events, driver inventory, app usage configuration, and other system usage data.
This data is provided through Microsoft.ConfigurationManagement.SensorFramework.dll, which surfaces insights about device activity and health. While the log can be opened and reviewed, it is generally not useful for troubleshooting app deployment or device check-in issues. Instead, it serves as a reference for system performance and usage events.
10. Win32AppInventory.log
Used when the device reports inventory of Win32 apps back to Intune. Tracks the scan of installed Win32 applications, versions, detection status, and reporting.
If your Win32 app shows incorrect detection state in Intune portal, this log helps trace the inventory dimension.
FAQs for Intune Management Extension Log Files
Q1. Where are Intune Management Extension log files stored?
The Intune Management Extension (IME) logs are stored in the following location on Windows devices:
This folder contains all IME-related logs such as IMEAgent.log, AppWorkload.log, AgentExecutor.log, and more.
Q2. What is IMEAgent.log used for?
IMEAgent.log is the main diagnostic log for Intune Management Extension. It records all key activities, including app detection, content download, install status, script execution, and communication with Intune services.This is the first log you should check when troubleshooting Win32 app issues.
Q3. Which IME log file helps with troubleshooting Win32 app downloads?
The AppWorkload.log file provides detailed information about content download, Delivery Optimization, staging, and download failures.
If a Win32 app is stuck at “Downloading” or “Waiting for install”, this is the log to check.
Q4. What log file shows PowerShell script execution from Intune?
PowerShell scripts executed by Intune via the IME are logged in AgentExecutor.log.
It records script start time, exit codes, execution errors, and the command line used by IME.
Q5. How do I know if the Intune Management Extension service is healthy?
You can verify IME agent health using ClientHealth.log, which records service startup, health checks, connectivity issues, and agent failures.
If IME is not running or not checking in, this log will show the cause.
Q6. Which IME log shows installed Win32 applications reported back to Intune?
The Win32AppInventory.log file captures details of discovered applications, detection results, version numbers, and what gets reported back to the Intune service.
Q7. How big can IME log files grow?
IME logs grow dynamically and rotate when large. While Microsoft does not publish an official hard limit, most logs rotate around 3 MB each, with older logs archived in the same folder.
If the Logs folder grows too large, it may indicate repeated failures.
Q8. Can I delete IME log files?
Yes. Log files can be safely deleted, but IME will recreate them automatically on next service restart.
However, deleting logs will remove diagnostic history, so only delete them if troubleshooting requires a clean baseline.
Q9. Does restarting the Intune Management Extension service generate new logs?
Yes. Restarting the IME service refreshes logging sessions and may rotate log files.
Q10. What is the difference between AppActionProcessor.log and AppWorkload.log?
-
AppActionProcessor.log tracks install/uninstall decisions, applicability, and assignment workflows.
-
AppWorkload.log tracks the operational part, downloading content, staging, DO/BITS activity, and app installation progress.
Together, they give a full picture of Win32 app deployment.


